One of the fascinating parts about the stock market is that practically everyone with an opinion about it is, more or less, right.
Is it a good way to build wealth? Yes.
Can it ruin fortunes? Also, yes.
Is it a Ponzi scheme? Kind of, in the sense that part of the reason it keeps going up is that there’s more money flowing into the markets than out of it.
Are there better options? With the same liquidity and risk levels, there aren’t many (if any?) better choices. Unless you pick thinly traded shares, you can usually exit a pedestrian-sized position in seconds. Try that with real estate or any other asset.
Given all that, you’d expect the stock market to be popular and for there to be a lot of participation. But, as you’d also expect, you need discretionary money if you want to invest in the stock market. You have to satisfy the more pressing needs in Maslow’s hierarchy before you can put it in an index fund at Vanguard.
So, who do you think owns stock in America?
This post was updated to use the 2022 Survey of Consumer Finances, the most recent data we have as of August 2024.
Table of Contents
🔃Updated August 2024: We have updated the data using the Survey of Consumer Finances data set from 2022 and Gallup updated their poll in May 2023. As of August 2024, this is the most recent data we can have.
Our Data Sources
Federal Reserve Survey of Consumer Finances
A great source of this information is the Federal Reserve’s Survey of Consumer Finances (SCF). The most recent SCF dataset was released for the year 2022.
We use this data when we looked at how millionaires made their money – it contains a lot of juicy information you can’t find (reliably) anywhere else.
The relevant section for us has to do with the ownership of financial assets. Financial assets include everything from checking and savings accounts to retirement accounts, life insurance, and other managed assets. We drill down into the section that includes ownership of publicly traded securities.
Gallup Poll
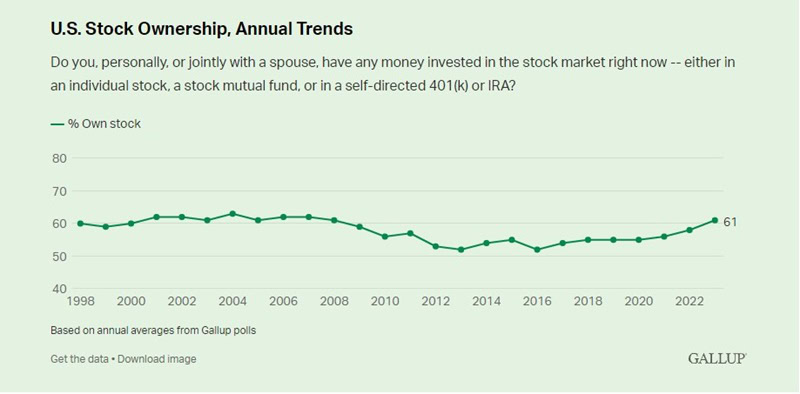
If you’re willing to take polling data into consideration as an accurate measure, we have more recent data. Gallup did a poll in May 2023 that found that 61% of Americans reported owning stock. This is a slight increase from 2020 (when 55% reported owning stock). Gallup has been doing this poll for years and the percentage has stayed within a tight range:
Only 58% of Families Own Stock
When you look at the entire population of the United States, less than 58% of families own stock. They can own it through a taxable brokerage account or a retirement account, but only 58% own any stock whatsoever.
This is an increase from 2019, when only 53% of families had stock holdings.
The telling statistics is how this changes based on your percentile of usual income (Table 7 of the SCF spreadsheet):
- Of the top 10% of income earners, 96.4% own stock (vs 92.3% in 2019).
- Of the 80-89.9% percentile of income, 91.7% own stock (vs 83.3% in 2019).
- Of the 60-79.9% percentile of income, 78.7% own stock (vs 71.0% in 2019).
- Of the 40-59.9% percentile of income, 60.2% own stock (vs 55.8% in 2019).
- Of the 20-39.9% percentile of income, 40.1% own stock (vs 34.2% in 2019).
- Of the bottom 19.9% percentile of income, just 17% own stock (vs 14.5% in 2019).
As for the median value of those holdings? For all families, the median is $52,000. (up from $46,400 in 2019)
The breakdown is:
- Of the top 10% of income earners, the median value is $607,100 (vs. $492,900 vs. 2019)
- Of the 80-89.9% percentile of income, the median value is $127,900 (vs. $101,100vs. 2019)
- Of the 60-79.9% percentile of income, the median value is $42,700 (vs. $39,100 vs. 2019)
- Of the 40-59.9% percentile of income, the median value is $24,000 (vs. $1,000 vs. 2019)
- Of the 20-39.9% percentile of income, the median value is $10,000 (vs. $1,900 vs. 2019)
- Of the bottom 19.9% percentile of income, the median value is $8,300 (vs. $8,000 vs. 2019)
(recall, the median income in the United States is $40,847.18)
This shouldn’t be surprising though. When the poverty line for a family of four in the lower 48 is $31,200, that doesn’t leave much room for investing in stocks. You’re too busy paying for housing, food, clothing, etc.
Where Do People Put Their Money?
If so few people own stock, and those that do own stock mostly hold it in retirement accounts, where do people keep their money?
Turns out the answer is not “in their mattress.”
Here’s the breakdown of what assets Americans have:
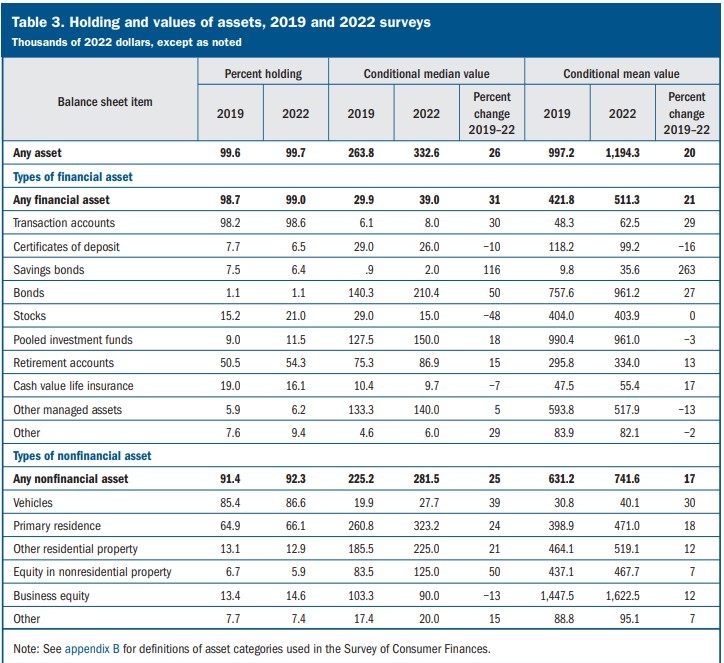
You have to read that table very carefully. The “Percent holding” columns in the table above shows the number of people who have a particular asset – such as a vehicle, home, CD, etc. This isn’t a measure of how much of their net worth is in a particular asset. In the columns above, in 2019, 99.6% of Americans have a financial asset of any kind.
The next two grouped columns, Conditional median value and Conditional mean value, explain the amounts in those asset types. In 2019, the Americans had a median of $29,900 in financial assets and $225,200 in nonfinancial assets.
What can we learn from this data?
For financial assets, almost everyone has a transaction account (checking, savings, etc.) and only half of all people have a retirement account. The next biggest category is 19.0% of Americans having a cash value life insurance policy.
The amounts are quite telling.
First, look at the massive difference between the conditional median and conditional mean! In the “Any financial asset” row for 2022, the median value is $39,000 whereas the mean value is $511,300! This shows there’s a significant concentration in wealth. As the old joke goes, whenever Bill Gates walks into the room, the average person in that room is now a millionaire!
Once you get past that, we find a few items that confirm what we’ve known from other data sources. Primary residence and residential property make up a significant portion of one’s net worth. From our look at average net worth, we know that most Americans have the majority of the net worth locked away in their home.
We also see a small increase in the nonfinancial asset category where only 66.1% of Americans own a primary residence. That’s down up from 64.9% in 2019.
Another gem? 86.6% own a vehicle, which is the most commonly held non-financial asset.
14.6% of Americans own business equity, which is any privately held business, a slight rise from 13.4% in 2019. More Americans with businesses as starting a business have become increasingly easier and entrepreneurship gains in popularity.
Conclusions
Building wealth is difficult but it’s made harder given the financial scenario many young people are in. The SCF also discusses other areas of American’s financial lives and one such area is debt and debt burden. Overall debt obligations increased from 2019 to 2022.
From the SCF document comparing 2016 with 2019: “Student debt continued to be the largest source, in dollar terms, of nonmortgage debt owed by families in the 2019 Survey of Consumer Finances (SCF) (see table 4 in the main text).”
This is a trend that follows the change from 2014 to 2016 – when analyzing that, we saw that median debt declined by 4% in those three years but the median value of education loans rose by 15% (from $16,500 to $19,000). The mean value rose 15% too, from $29,800 to $34,200. The share of families with education loans also increased from 20% to 22.4%. If you look at the outstanding student loans, courtesy of the St. Louis Fed, we’re looking at a total of over $1.753 trillion (as of August 5, 2024).
We see this in our low rates of stock ownership, decreasing rates of homeownership, and other social measures like when people choose to get married, start a family, etc. These traditional milestones are being delayed for a variety of reasons but when it comes to the financial ones, it’s hard to invest when you are carrying around an education debt. That’s likely why we see high rates of retirement assets but relatively lower rates for non-retirement investments.
This also means that when we conflate the economy with the stock market, only half of all Americans participate. The stock market might be hitting record levels but for half of Americans, it doesn’t matter. For the other half, many likely have such low levels of market holdings that it won’t have an impact even given the rise.
We see this in the data in several places. If you look at the before-tax family income, distributed by income sources, by percentile of net worth, we see the following breakdown (Table 2):
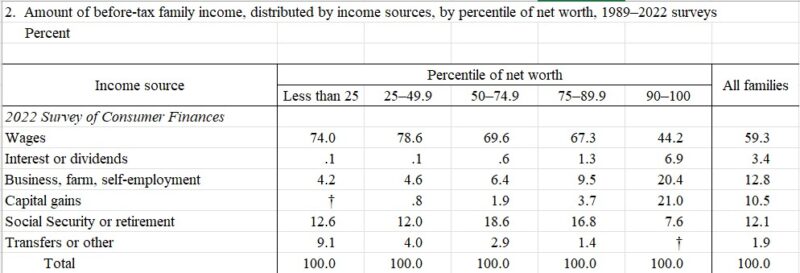
Of the bottom 75% of Americans, less than 1% of their income was derived from interest or dividends. Very little of it was derived from capital gains either.
Compare that to the top 10%, where 27.9% of their income came from interest, dividends, and capital gains!
When the stock market goes up, many Americans simply don’t participate in any meaningful way.


wow
It’s unfortunate that nearly half the nation doesn’t benefit from stock ownership, but what’s even more surprising to me is the fact that participation in cash value life insurance is actually increasing.
Shows the power of salesmanship, I guess.
Best,
-PoF
It certainly does show the power of salesmanship – a lot of times people go into those sales situations not knowing the landscape and what’s available. They think that the person in front of them is an expert (and a fiduciary) so they believe that they say at face value.
With the rise of crowdfunding platforms to invest in real estate, which is really a paper asset than real property, I wonder how statistics will change going forward. Aside from not having capital to invest in stocks of companies, i think people are intimidated by it and also feel a lack of control. Some of these things may be helped when real estate is the underlying investment. It’s too soon to tell, but there are so many more investment options now with the fintech boom, and people are waking up to having to take a more active role in their… Read more »
What I would love to know is how many of these people who own no stocks are making low-quality decisions and blowing their money on things like $50,000 cars with financing versus how many of them are just facing difficult economic circumstances. It’s not something that anybody ever addresses because this would acknowledge that people are to some degree responsible for their financial situation.
While that’s an interesting distinction, I’d argue that it doesn’t really matter unless someone is advocating that you give those individuals (either category) money to invest. You can only incentivize it (with deductions, credits, etc.) and the ones who are wise will do it.
There’s some great data here Jim. That 20% own a cash value policy is astounding. Fewer than 1% of the population could actually benefit from one. Shows the power of commissioned salespeople!
Hopefully the trend of stock ownership increases. My younger siblings just got new jobs and employers actually make it pretty simple to invest in retirement accounts. I told them both to contribute up to the match and just invest in a target date fund for now since they’re starting out. Luckily they both listened!
I think a lot of people grow up thinking there are experts and you put a salesperson dressed up as a “financial professional” and they buy whatever that person is selling.
I hope it increases too – it’s hard when we just had the Great Recession (10 years ago but still fresh in people’s memory) on top of already dismal savings rates.
Outstanding Information and surprised me!
Thanks 😀👍👍
You’re welcome!
Hopefully some of these new Apps like Acorn that round up to the next dollar and then invest it will help the next generation get a feel for it but ultimately I think the best tool is parents taking time with their kids to explain it and then model it.
I think of all the comments, Trevor hit it “right-est.” Jim, you write a terrific column with great info and I will bet that most of your readers are like those who commented here, people who “get it” and realize that they have to, and have the opportunity to build wealth during their working lives and spend a fair amount of thought and some worry about the issue. I suggest that most of those people who don’t get it/worry also don’t read these columns, instead reading all the things telling them they are going to suffer but without much enlightenment… Read more »
Wow, mind blowing post. Thank you!
What gets me is that the conditional median value of financial assets was $23.5K in 2016 while vehicles were $17.3K. Most people’s priorities are our out of wack if you ask me. Yikes.
Well, to be fair, most people in the United States benefit from owning a car because public transportation isn’t as good as it should be. If I take only public transportation to try to get to the local mall, it would take at least an hour and a half or a 20 minute drive.
The average cost of a used car is around $20k right now. Most American workers need a car.
You seem to have left out all the pension funds owned by states & municipalities and unions and old-style (pre-401K) corporate pensions. According to this website, https://economics21.org/stock-ownership-equity-wealthy, “by many measures the ownership of capital has never been more equal. For instance, two thirds of the stock market (public markets) is owned by institutional investors, including pension funds who invest their assets on behalf of working people who make up the bottom 90%. Pension funds also are among the biggest investors in private equity.” – note that – private equity too! So, even if it’s not in their individual name, people… Read more »
We can look to do that when we revisit the data, thanks!